How we measure
Every conclusion is only as good as the data it is based on. That's why we use peer-reviewed, laboratory-validated methodology, delivered entirely through the browser.
Eye tracking
Our webcam-based eye tracking measures where participants look with 1.4° spatial accuracy validated against EyeLink 1000 laboratory systems in peer-reviewed research. We capture fixation locations, fixation duration, dwell time, saccades, and time-to-first-fixation.
Every study type, this is our core signal to measure attention.
Lower spatial resolution than most hardware eye trackers, 30Hz sampling rate or lower depending on the device, requires adequate lighting and stable head posture, some participants will be excluded for poor calibration.
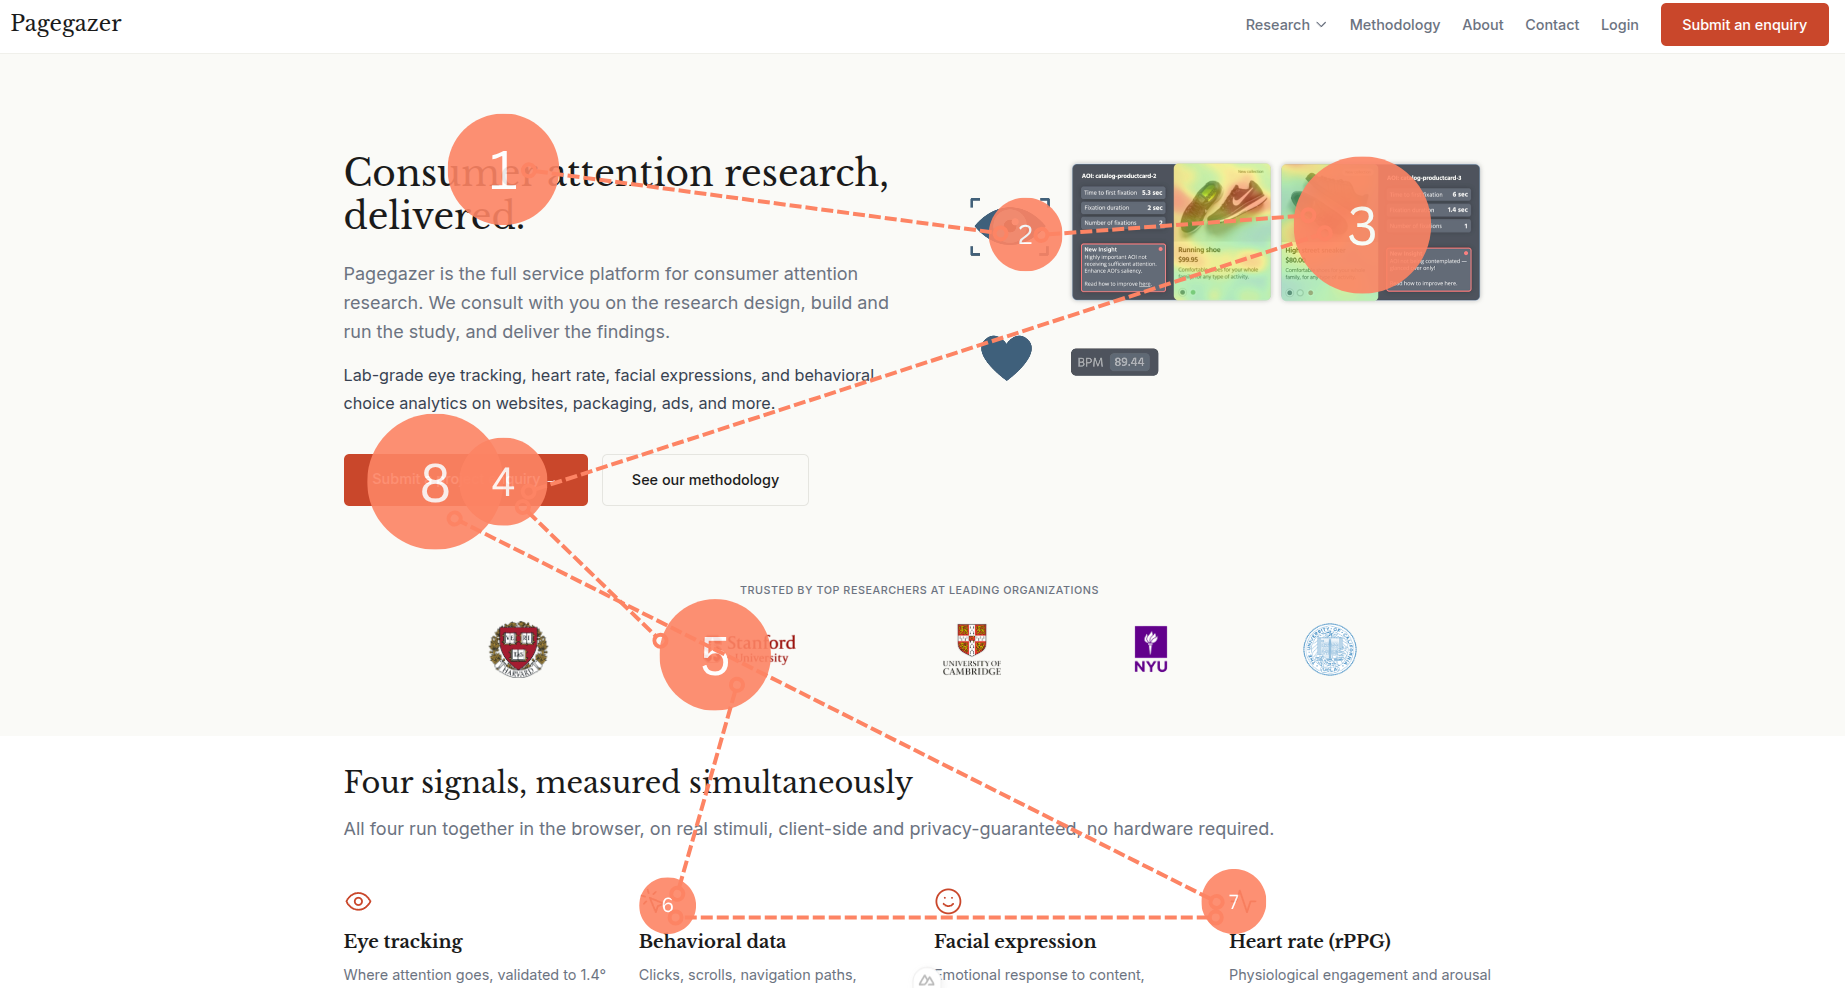
Gaze scan path for a single participant. Numbers indicate fixation order; circle size indicates fixation duration.
Behavioral measurements
We capture clicks, scrolls, navigation paths, time-on-task, hover patterns, reaction times, choices, and keystrokes.
Digital experience usability testing (task time, errors, effort), behavioral & custom research (reaction times, choices), any study that requires behavioral data.
None, our behavioral measurements are millisecond precise and reliable.

Self-checkout usability test: three kiosk layouts × two age groups across task time, revisits (an error proxy), and total mouse-path length. Design B stays robust with age; Design C collapses for the 60+ group.
Surveys & self-report
Alongside the implicit signals we collect demographics, screening questions, attitude scales, and post-task ratings in the same platform. Explicit responses give the behavioural and biometric data context: they segment the sample, explain why subgroups responded differently, and surface the gap between what people say and what their attention and physiology show they did.
Most studies. Demographics are almost always useful to segment the sample; post-stimulus ratings help capture conscious preference; attitude and intent scales help compare stated response against measured attention and emotion.
No technical limitations. We usually don't treat it as an outcome on its own, but as a complement to the implicit measures.

Post-task agreement items, split by gender. Both groups read the design as premium — but only women turn that into purchase intent, a divergence the aggregate would hide.
Heart rate measurement (rPPG)
Remote photoplethysmography extracts heart rate / pulse from the webcam video feed. No contact sensor needed. Indicates physiological engagement, arousal, and stress response.
Ad & video research (engagement timeline), checkout flows (stress at payment), any study where physiological response matters.
Less precise than contact sensors. Affected by lighting conditions and participant movement.
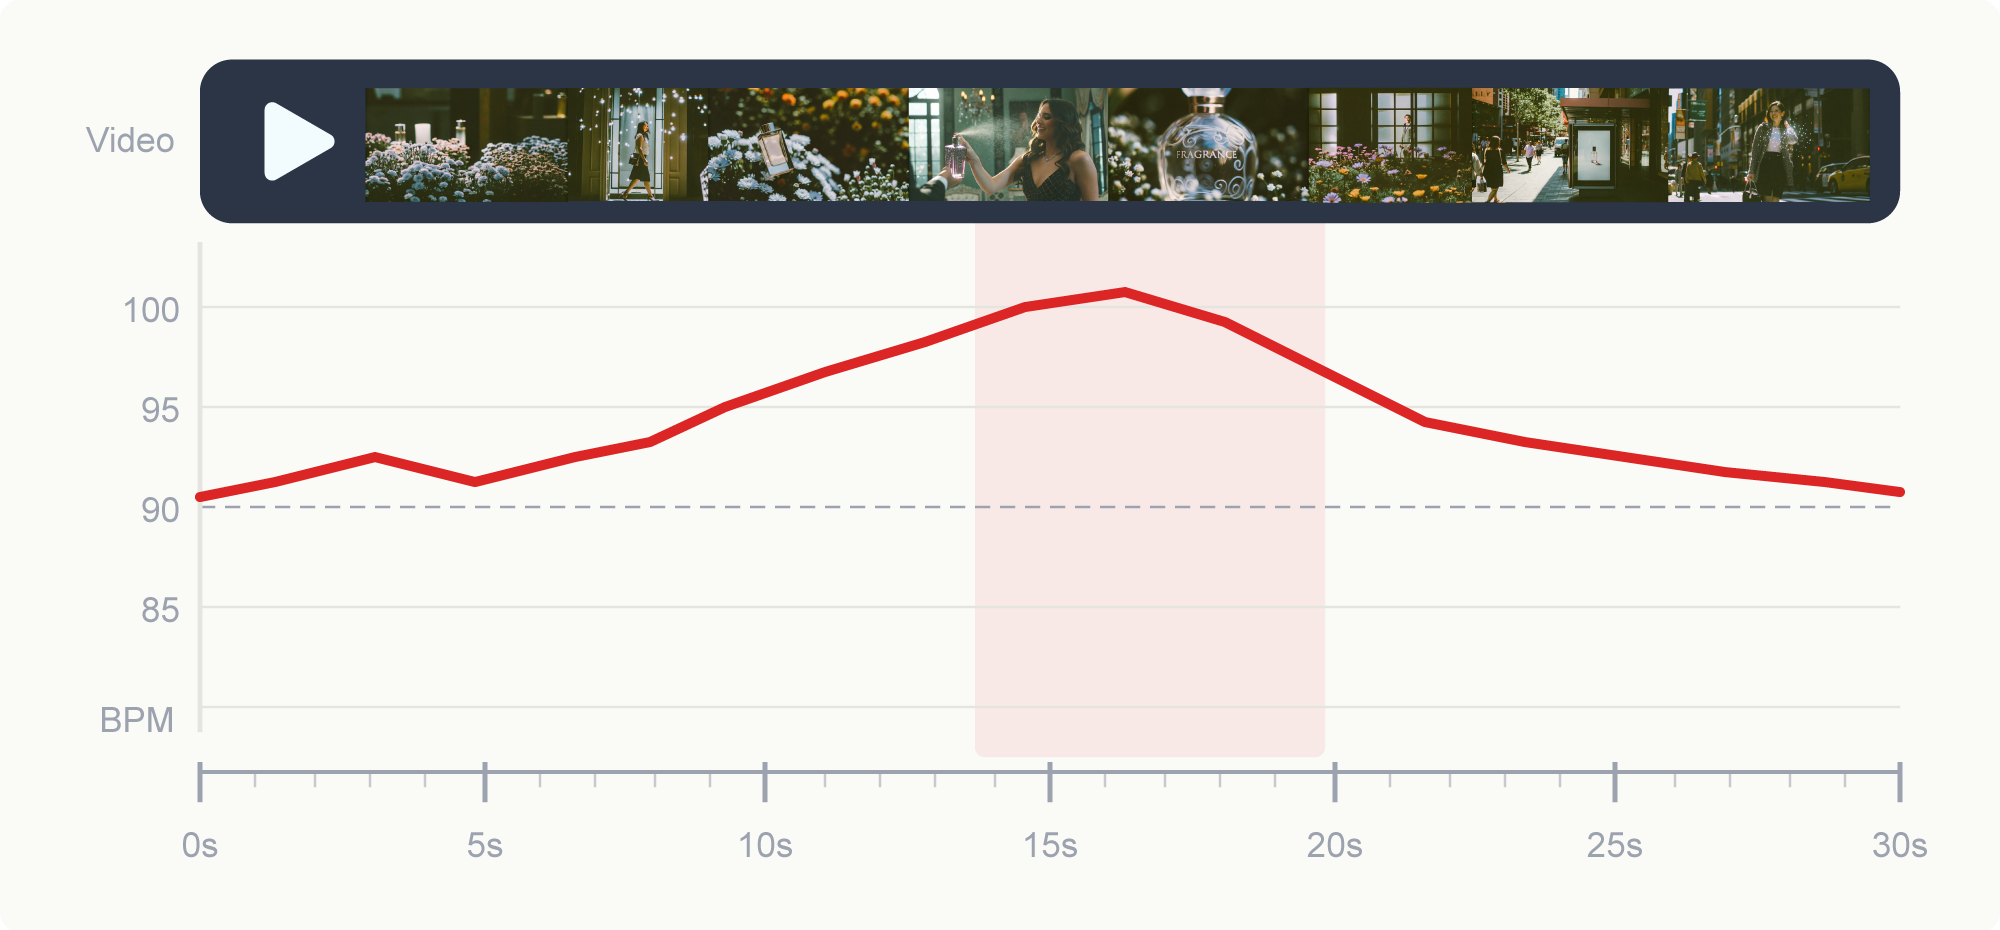
Heart rate over time (rPPG).
Facial expression analysis
Facial landmark detection and expression classification captures emotional response in real time. We measure 7 basic expressions, valence (positive/negative), and arousal.
Ad & video research (emotional arc), packaging (preference response), any study where emotional response is a key question.
Facial expressions vary across cultures. Not all inner states produce visible expressions.
 A
A B
B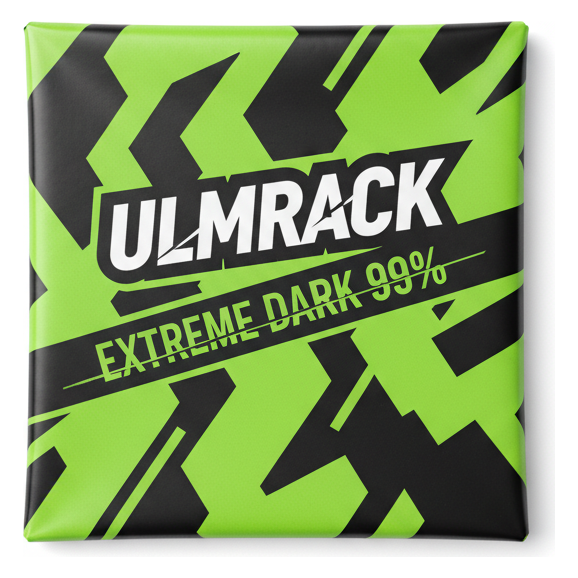 C
C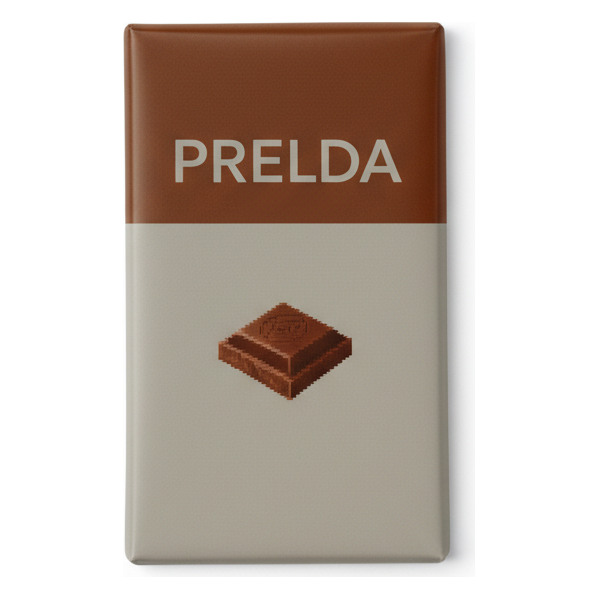 D
DJoy and surprise responses, mean arousal, and mean valence across four packaging variants.
Data quality controls
We validate individual participant data quality through calibration thresholds, environmental checks (lighting, camera angle), and statistical validation. Typical exclusion rates are 5–10%. All findings include sample sizes, power analysis, and significance testing.
Privacy and ethics
All studies are GDPR-compliant. Participants give informed consent, can withdraw at any time, and their data is processed locally in the browser before any transmission. No face data or other personally identifiable data ever leaves the browser. We offer configurable data exports and can provide DPAs for regulated industries.
Our advantage
Our unique advantage is that we are both UX researchers and platform providers in one. This means we can offer the best of both worlds: We understand the requirements of commercial research, but also provide the latest technologies and the power of a web-based platform.